
If you’re looking to improve your trading, understanding pivot points is a good place to start.
What are trading pivot points
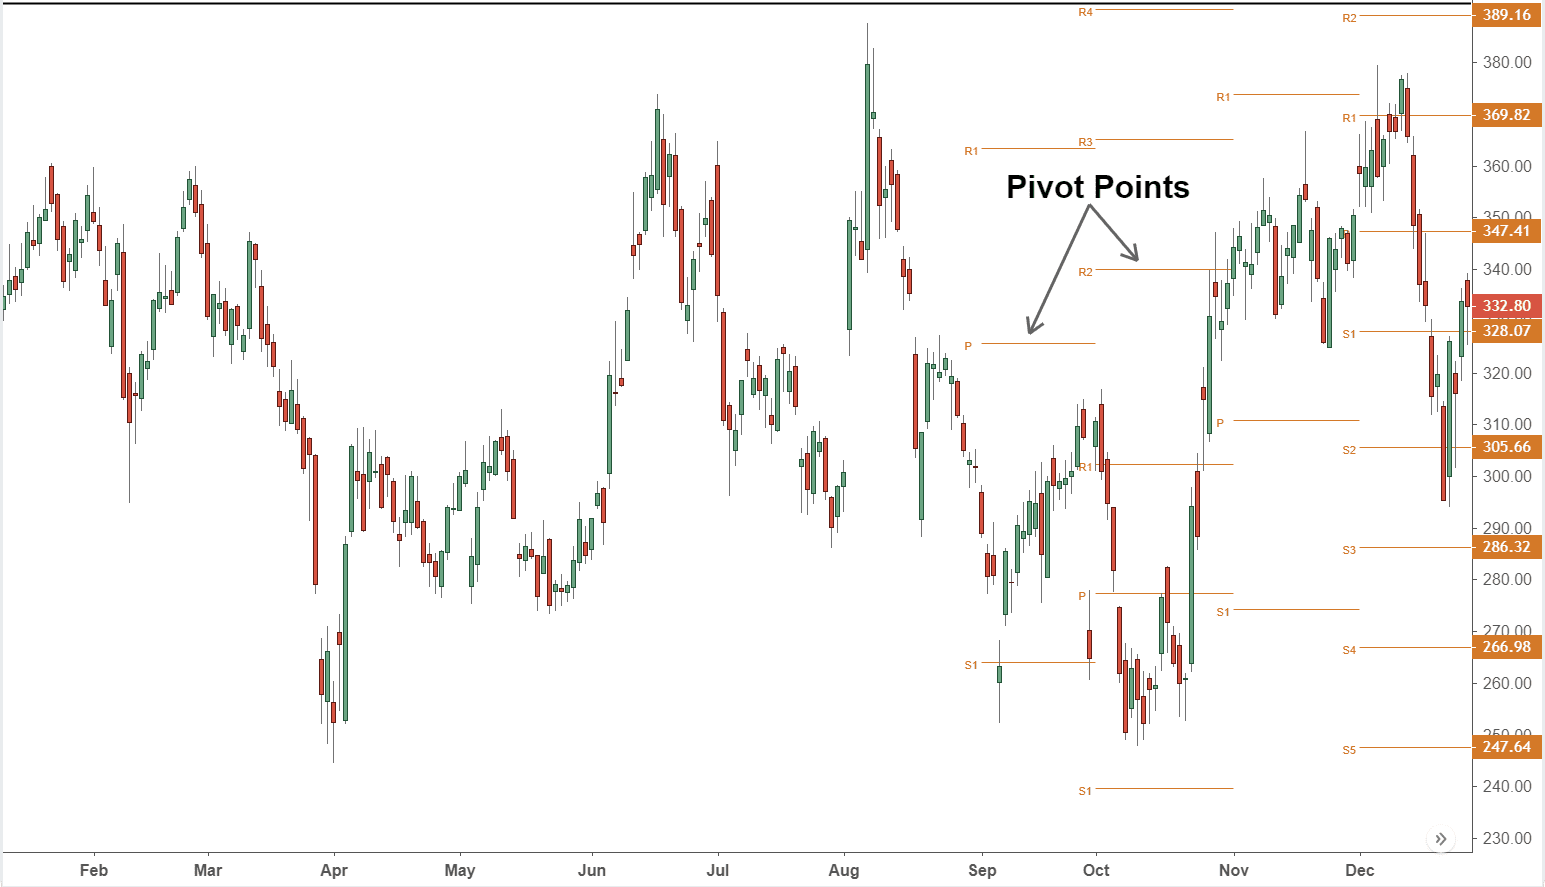
Pivot points are technical analysis indicators used by traders to identify potential support and resistance levels in the market.
Most pivot point strategies use a combination of the main support and resistance levels along with the Fibonacci levels to find potential trading opportunities.
The main support and resistance levels are calculated by taking the average of the high, low, and close prices from the previous day. The Fibonacci levels are then calculated by taking the difference between the high and low prices and multiplying it by the Fibonacci ratios of 23.6%, 38.2%, and 61.8%.
The main support and resistance levels are important because they represent the most likely areas for the price to reverse direction. The Fibonacci levels are important because they represent areas where the price is likely to find support or resistance.
Traders can use pivot points to identify potential trading opportunities by looking for price reversals at the main support and resistance levels or by looking for breakout trades at the Fibonacci levels.
Pivot point strategies can be used on any time frame but are most commonly used on daily charts.
How do you calculate trading pivot points

Pivot points are technical analysis tools that are used to determine the direction of the market over different time frames. The most common time frames are daily, weekly, and monthly.
To calculate a pivot point, you first need to identify the high, low, and close prices for the period you are interested in. For example, if you are calculating the daily pivot point, you would use the previous day’s high, low, and close prices. Once you have these values, you can use a simple formula to calculate the pivot point.
The formula for calculating a pivot point is:
Pivot point (PP) = (High + Low + Close) / 3
First support level (S1) = (2 * Pivot Point) – High
First resistance level (R1) = (2 * Pivot Point) – Low
Second support level (S2) = Pivot Point – (High – Low)
Second resistance level (R2) = Pivot Point + (High – Low)
Third support level (S3) = High + 2 * (Pivot Point – Low)
Third resistance level (R3) = Low – 2 * (High – Pivot Point)
Pivot points can be used to determine the overall trend of the market as well as potential support and resistance levels. If the market is trading above the pivot point, it is said to be in an uptrend. If the market is trading below the pivot point, it is said to be in a downtrend.
The support and resistance levels can be used to set stop-loss orders or take profit orders. For example, if you are long on a stock and the stock price reaches the R1 resistance level, you might want to take some profits off the table. Alternatively, if you are short on a stock and the stock price reaches the S1 support level, you might want to exit your position or take profits.
Pivot points are just one of many technical indicators that traders use to make decisions. As with all technical indicators, they should be used in conjunction with other indicators and fundamental analysis before making any trading decisions.
What is the difference between a daily pivot point and a weekly pivot point
A daily pivot point is a technical analysis indicator used by day traders that shows the average price level for a given day. A weekly pivot point is a technical analysis indicator used by longer-term traders that shows the average price level for a given week.
The main difference between a daily pivot point and a weekly pivot point is the time frame that each one covers. A daily pivot point only covers one day, while a weekly pivot point covers an entire week. This means that a daily pivot point is more sensitive to short-term price changes than a weekly pivot point.
Another difference between these two technical indicators is how they are calculated. A daily pivot point is calculated using the opening price, high price, low price, and closing price from the previous day. A weekly pivot point is calculated using the opening price, high price, low price, and closing price from the previous week.
Some traders use both daily and weekly pivot points in their trading strategy. By looking at both time frames, they can get a better idea of where prices are likely to move over the short-term and long-term.
What is the most important thing to remember when trading pivot points
Pivot points are technical indicators used by traders to assess market conditions and potential trading opportunities.
The most important thing to remember when trading pivot points is that they are a leading indicator, which means they can help you anticipate future price movements. However, it is also important to keep in mind that pivot points are not infallible, and that other factors such as market sentiment and news events can also impact price movements.
What are some common mistakes traders make when trading pivot points
Pivot points are a technical indicator used by traders to identify potential support and resistance levels in the market. They are calculated using a simple formula that takes into account the previous day’s high, low and close price.
While pivot points can be a useful tool for identifying potential trading opportunities, there are a few common mistakes that traders make when using them.
One of the most common mistakes is failing to take into account the overall trend. Just because a stock is trading at or near a pivot point does not mean it is a good time to buy or sell. Traders need to look at the bigger picture to see if the stock is in an uptrend, downtrend or sideways trend before making any decisions.
Another mistake traders make is not using stop-loss orders when trading around pivot points. Because prices can quickly move through support and resistance levels, it’s important to place stop-loss orders to protect your profits (or limit your losses).
Finally, some traders try to pick tops and bottoms by entering into trades when prices touch or bounce off of support and resistance levels. This can be a risky strategy as it’s often difficult to predict exactly when prices will reverse course.
If you’re thinking about using pivot points in your trading, make sure you avoid these common mistakes. And, as always, remember to use stop-loss orders to protect your positions.
How can you use trading pivot points to your advantage

If you are new to the world of trading, then you may not have heard of pivot points before. Pivot points are simply a technical indicator that is used by many traders to help them make decisions about their trades.
The way pivot points work is that they take the average of the high, low, and close prices from the previous day (or any other time period) and then use that information to calculate a new price level that is considered to be important. This new price level is called a “pivot point.”
There are a few different ways that traders can use pivot points to their advantage. One way is to use them as a way to enter or exit trades. For example, if the price of a stock is trading below its pivot point, then that may be a signal to sell. Or, if the price is trading above its pivot point, then that could be a signal to buy.
Another way to use pivot points is to use them as a target for setting stop-loss orders. For instance, if you buy a stock at $100 and its pivot point is at $105, then you may want to set your stop-loss order at $103 (just below the pivot point). That way, if the stock does start to fall, you’ll limit your losses.
Finally, some traders also like to use pivot points as a way to identify potential areas of support and resistance. If the price is bouncing off of its pivot point, then that may be an indication that there is some underlying buying or selling pressure at that level.
Overall, using pivot points can be a helpful tool for traders. They can be used in a number of different ways, and they can be applied to any time frame (intraday, daily, weekly, etc.). So if you’re looking for another indicator to help you make trading decisions, then consider using pivot points.
What are some common indicators used in conjunction with trading pivot points
Pivot points are a technical analysis tool used by traders to identify potential support and resistance levels in the market. They are calculated using a simple formula that takes into account the high, low, and close prices from the previous period.
There are a few different ways that traders use pivot points to make decisions about their trades. Some use them as a sole basis for their decision making, while others use them in conjunction with other technical indicators.
One of the most common ways that pivot points are used is in conjunction with support and resistance levels. Traders will look for price action to confirm these levels before making a trade. This can be done by looking for price to bounce off of support or resistance levels, or by looking for price to break through these levels.
Another way that pivot points are used is in conjunction with Fibonacci retracements. Traders will look for price to retrace a certain percentage of the previous move before making a trade. This is often used as a way to enter into trades at key levels.
Finally, some traders use pivot points as a way to time their entries and exits. They will look for price to reach a certain level and then make their trade. This can be done by looking at the level itself, or by using moving averages to help time the trade.
Pivot points can be a helpful tool for traders, but they should not be used as the sole basis for decision making. Instead, they should be used in conjunction with other technical indicators to give traders a better idea of where the market is headed.
How can you use price action to trade pivot points
Pivot points are an important tool that technical traders use to help identify potential turning points in the market. By looking at the price action around previous pivot points, traders can get a better idea of where the market might turn next.
One way to trade pivot points is to look for reversals around these levels. If the market is trading below a pivot point and starts to move back up towards it, this could be a potential buying opportunity. Similarly, if the market is trading above a pivot point and starts to move back down towards it, this could be a potential selling opportunity.
Another way to trade pivot points is to look for breakouts. If the market breaks through a pivot point to the upside, this could be a signal that further upside is possible. Likewise, if the market breaks through a pivot point to the downside, this could be a signal that further downside is possible.
Whichever way you choose to trade pivot points, it is important to remember that they are just one tool in your technical analysis toolbox. As with any tool, they should not be used in isolation but should be combined with other technical indicators to give you a more complete picture of the market.
What are some other strategies that can be used to trade pivot points
When it comes to trading pivot points, there are a few different strategies that can be used. One popular strategy is to look for breakouts. This involves watching for price to move outside of the pivot point range and then entering a trade in the direction of the breakout. Another strategy is to use the pivot points as support and resistance levels. This means watching for price to bounce off of the pivot point levels and then entering a trade in the opposite direction.
Is there a difference between trading and investing when using pivot points
Pivot points are a technical analysis tool that is commonly used by traders and investors to identify potential support and resistance levels in the market. While there are some similarities between trading and investing when using pivot points, there are also some key differences.
For traders, pivot points can be used to help identify potential entry and exit points in the market. They can also be used to help determine appropriate stop-loss levels. For investors, pivot points can be used to help identify potential opportunities for buying or selling. However, investors will typically take a longer-term view when using pivot points, whereas traders will take a shorter-term view.