Scalper Trading Strategies: The Pros, The Cons, And How To Make Them Work For You
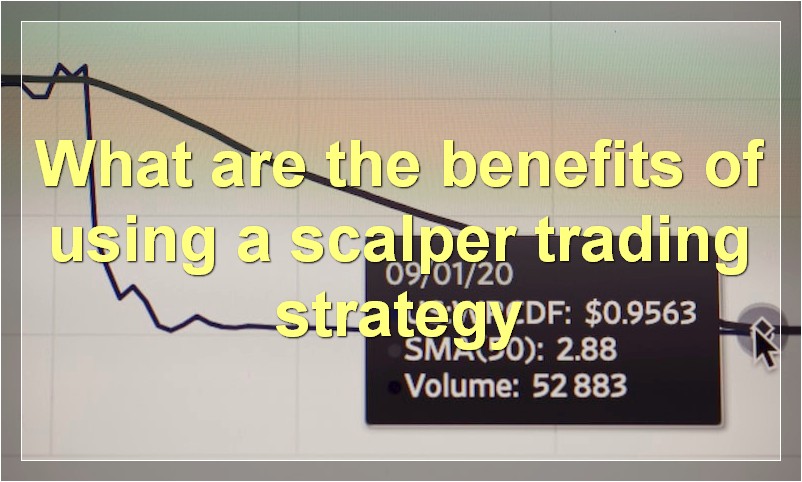
Are you looking to make some quick money? Or are you hoping to take your investing to the next level? If so, then scalping might be the trading strategy for you. Scalping is a high-frequency trading strategy that can be used to make small but consistent profits. But before you start scalping, it’s important to understand the pros and cons of this strategy. In this article, we’ll give you an overview of scalper trading strategies and how you can make them work for you.